Observability in a Box
(OIB)
The complete Grafana LGTM stack. Logs, metrics, traces, and profiling — configured and ready to run.
A preconfigured observability stack for local development, homelabs, and small teams. Run metrics, logs, traces, profiles, dashboards, health tooling, and instrumented examples without outsourcing the evidence.
⚡ Quick Start
# Clone and configure
git clone https://github.com/matijazezelj/oib.git && cd oib
cp .env.example .env  # Edit and set GRAFANA_ADMIN_PASSWORD

# Install and explore
make install
make demo
make open
That’s it. Open http://localhost:3000 and start exploring your data.
📦 What’s Included
| Stack | Components | Purpose |
|---|---|---|
| Logging | Loki 3.3.2 + Alloy v1.5.1 | Centralized log aggregation with automatic Docker log collection |
| Metrics | Prometheus v2.48.1 + Alloy v1.5.1 + cAdvisor v0.47.2 + Blackbox Exporter v0.25.0 | Host metrics via Alloy, container metrics via cAdvisor, endpoint probing |
| Tracing | Tempo 2.6.1 + Alloy v1.5.1 | Distributed tracing with OpenTelemetry support |
| Profiling | Pyroscope | Continuous profiling (optional: make install-profiling) |
| Visualization | Grafana 11.3.1 | Pre-built dashboards for all four pillars |
| Testing | k6 | Load testing with metrics streaming to Prometheus |
🔌 Integration Endpoints
Once installed, your applications can send data to:
| Signal | Endpoint | Protocol |
|---|---|---|
| Traces | localhost:4317 |
OTLP gRPC |
| Traces | http://localhost:4318 |
OTLP HTTP |
| Profiles | http://localhost:4040 |
Pyroscope SDK (optional) |
| Logs | Automatic | Docker containers are auto-collected |
| Probing | http://localhost:9115 |
Blackbox Exporter (localhost only) |
| Alloy (logging) | http://localhost:12345 |
Alloy logging pipeline UI |
| Alloy (metrics) | http://localhost:12347 |
Alloy metrics pipeline UI |
📊 Pre-built Dashboards
OIB comes with six ready-to-use Grafana dashboards:
| Dashboard | Description |
|---|---|
| System Overview | Container CPU/memory, disk usage, network I/O |
| Host Metrics | Detailed host system metrics (CPU, memory, disk, network) via Alloy |
| Logs Explorer | Log volume, live logs, errors/warnings panel |
| Traces Explorer | TraceQL examples, Python, Node.js, Ruby & PHP code samples |
| Profiles Explorer | CPU, memory, and goroutine profiling with Pyroscope |
| Request Latency | Endpoint probing (Blackbox), k6 load test metrics, latency percentiles |
📸 Screenshots
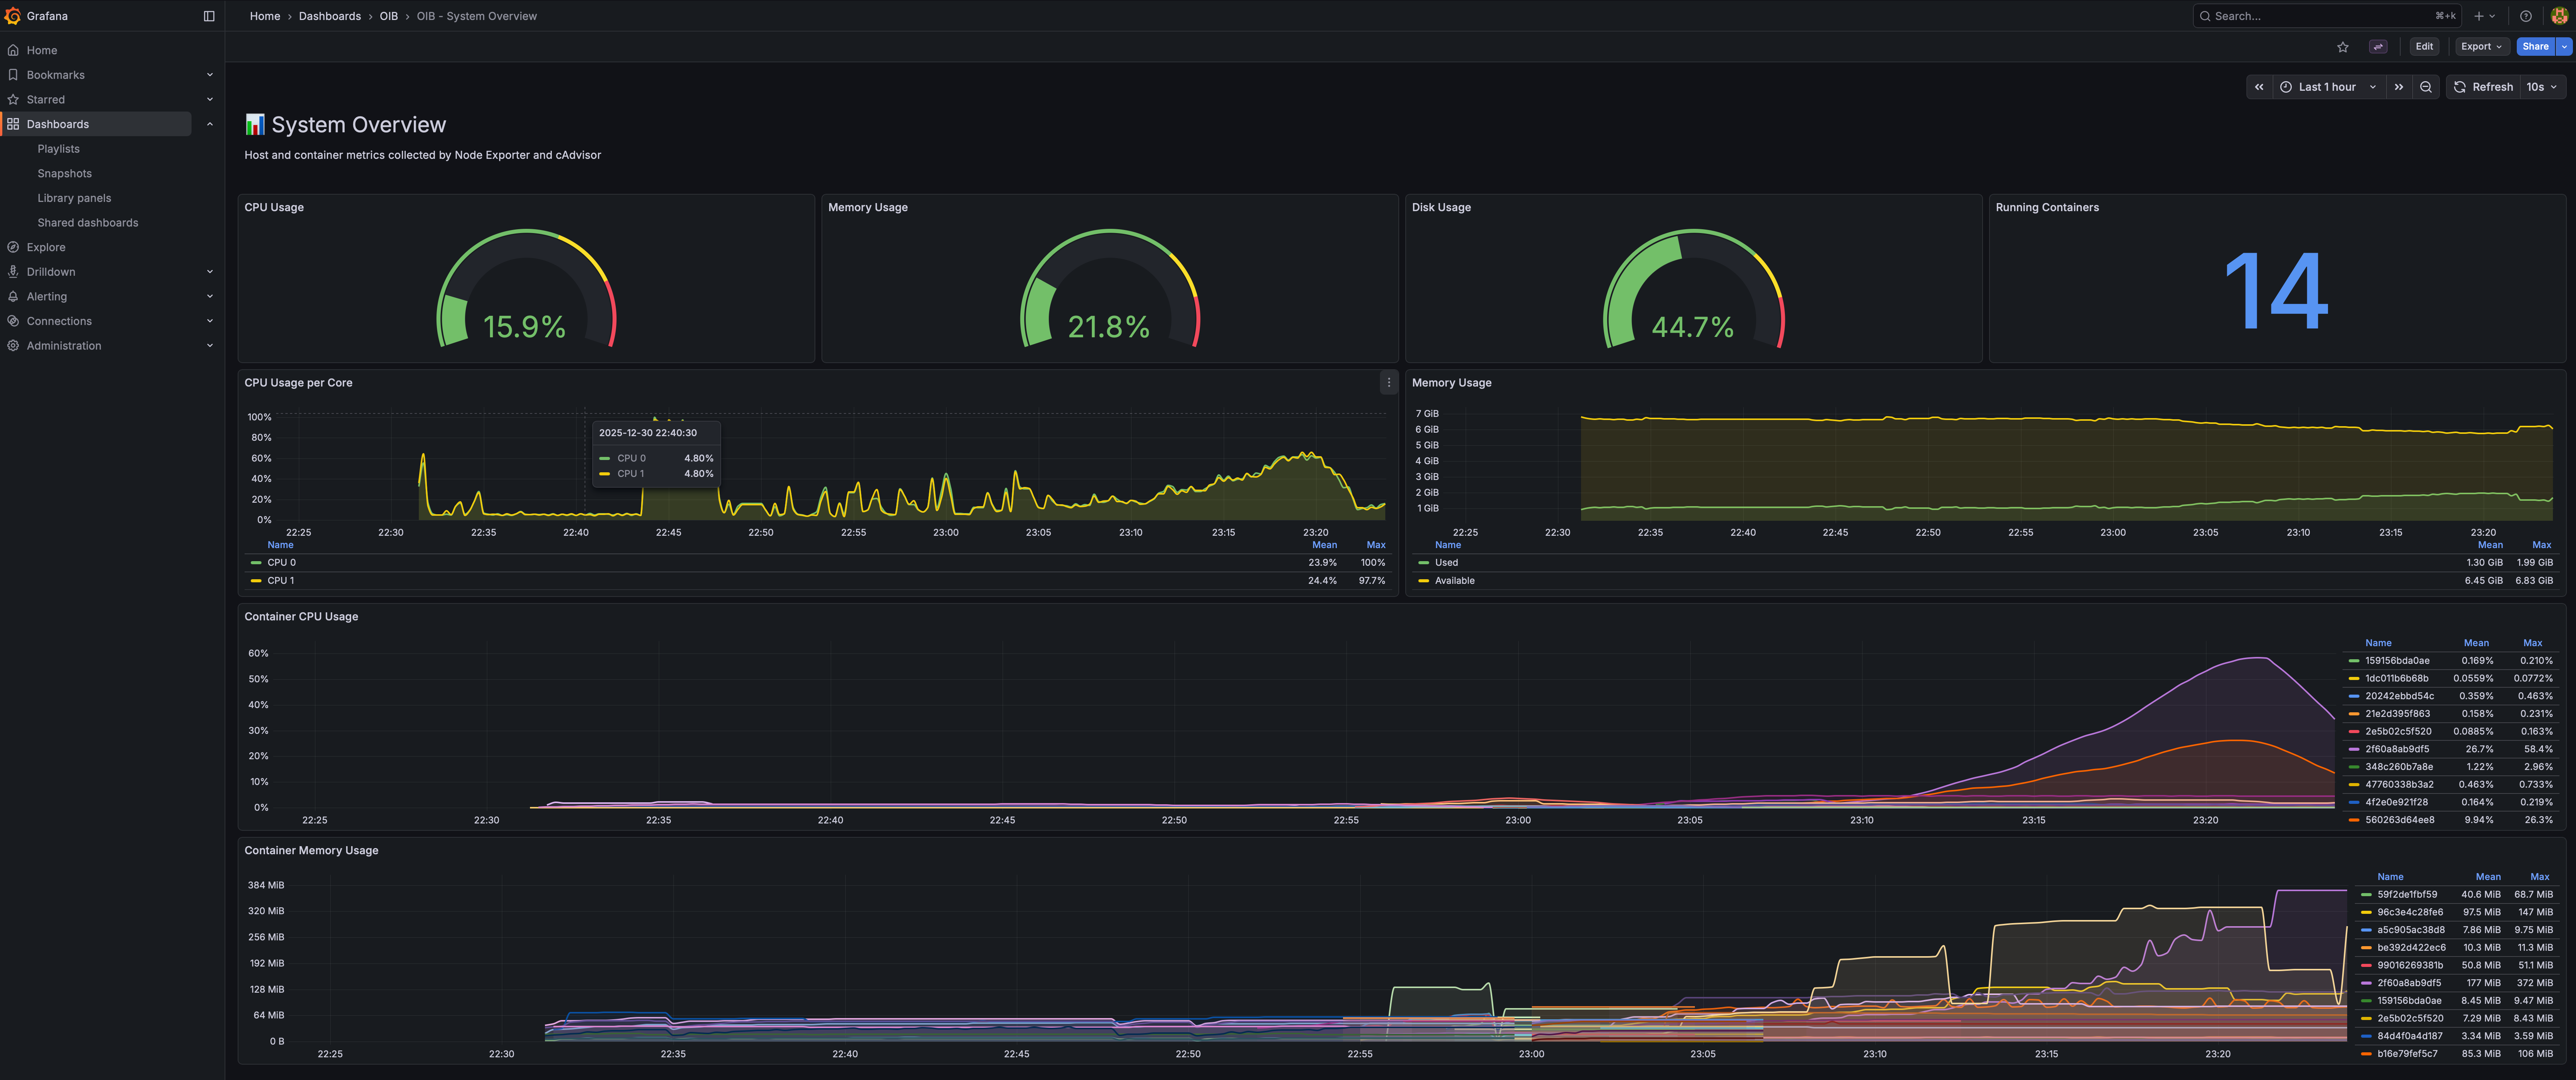
System Overview
Real-time CPU, memory, disk gauges plus per-container resource usage.
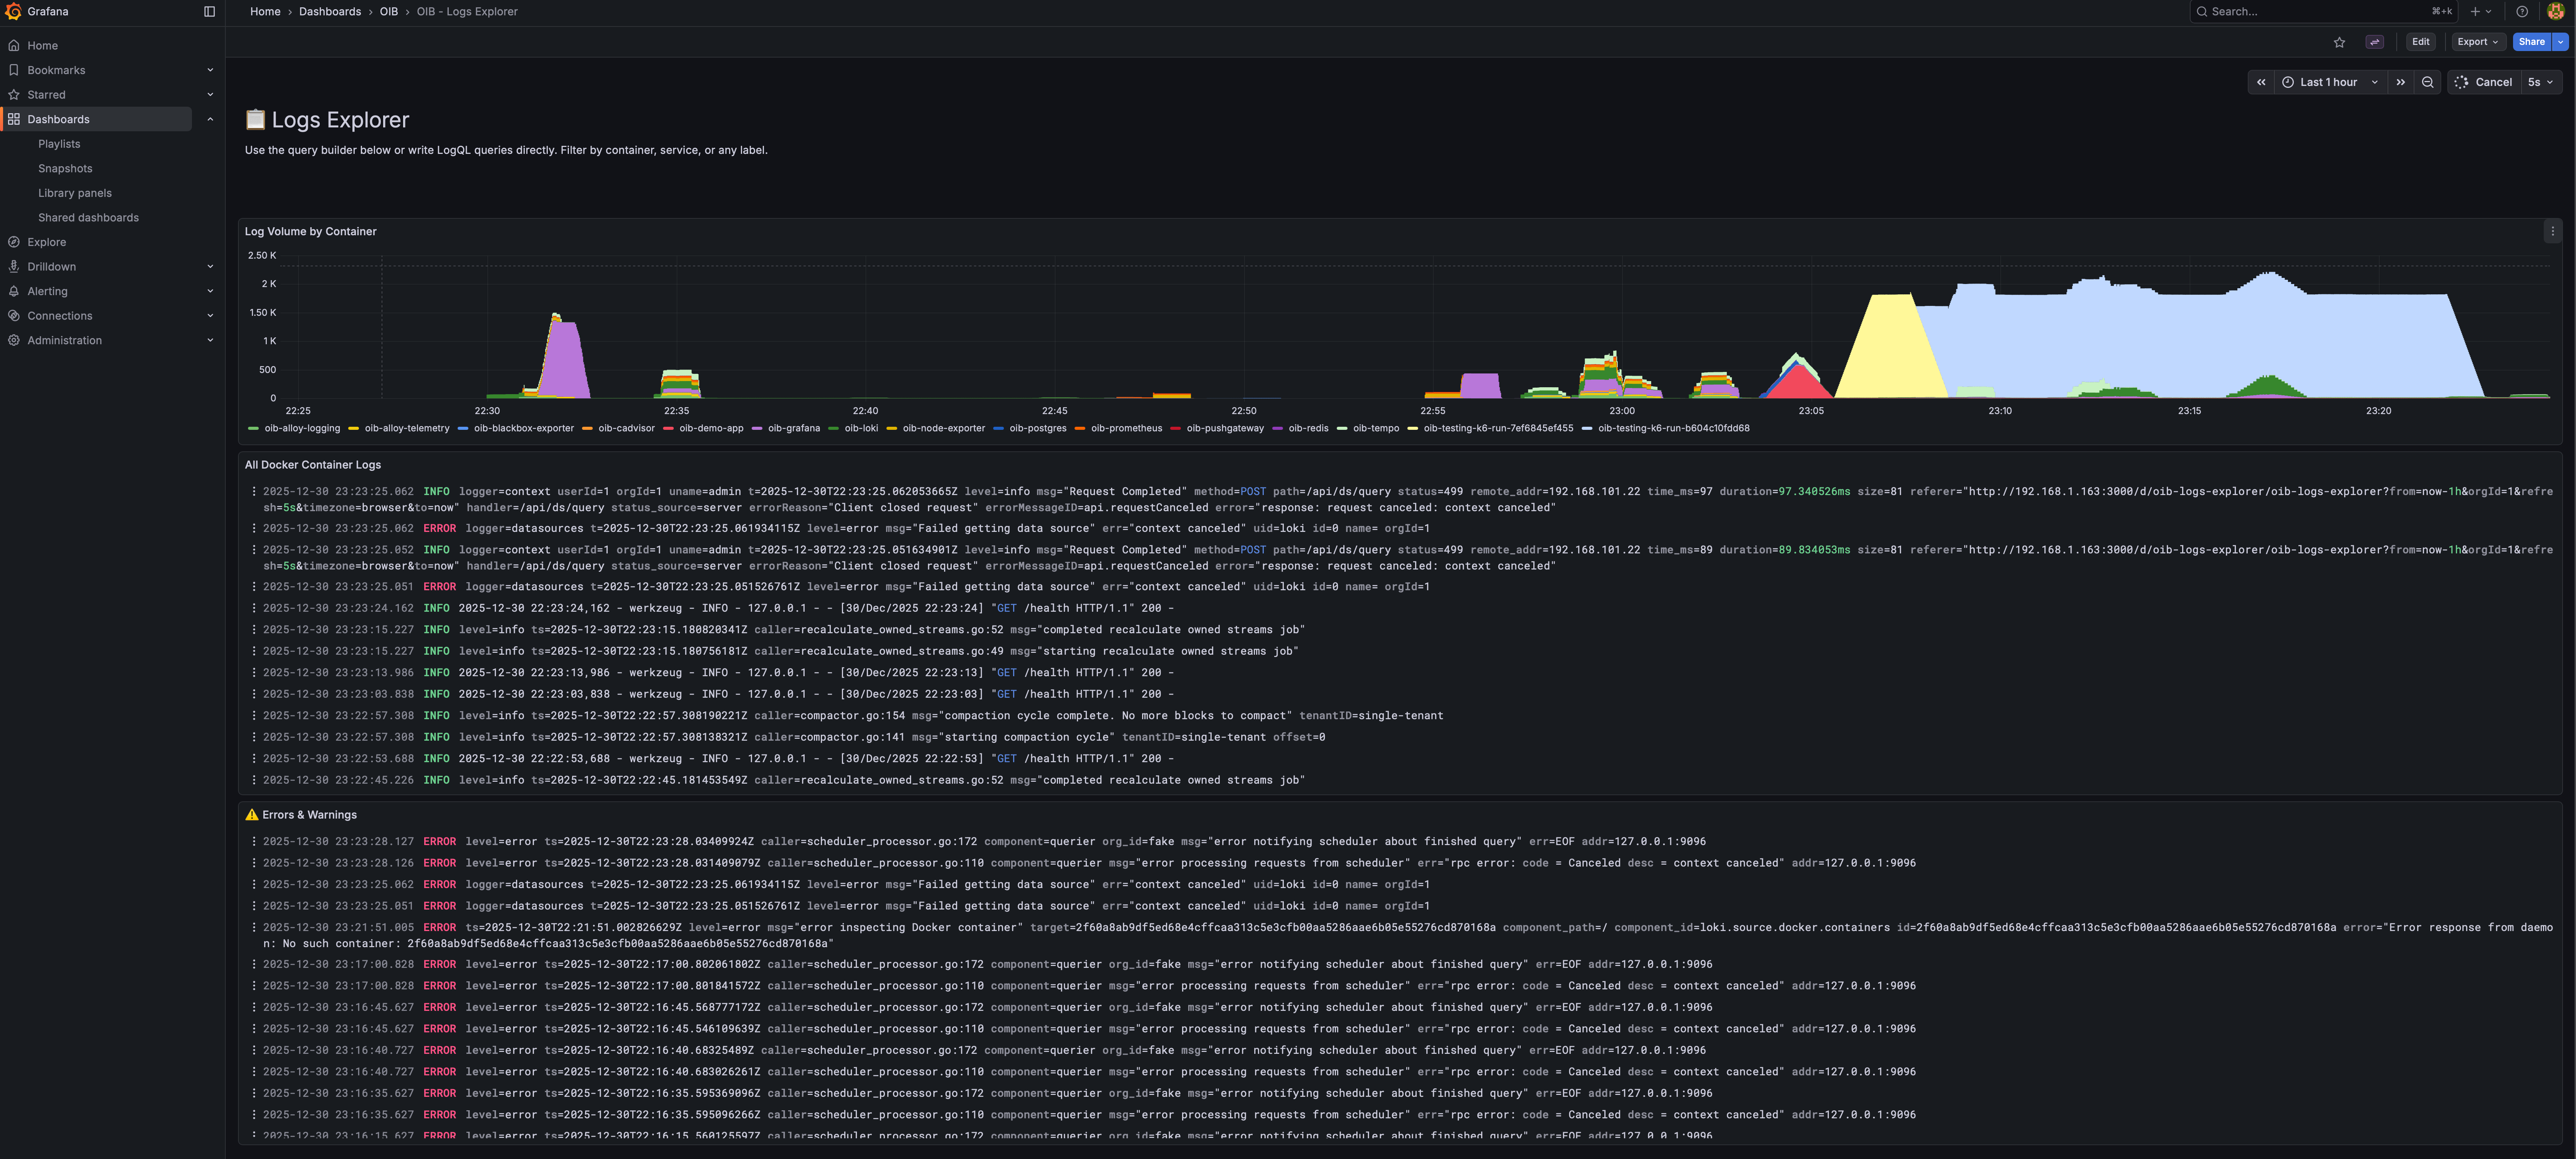
Logs Explorer
Log volume by container, live log stream, and dedicated errors/warnings panel.
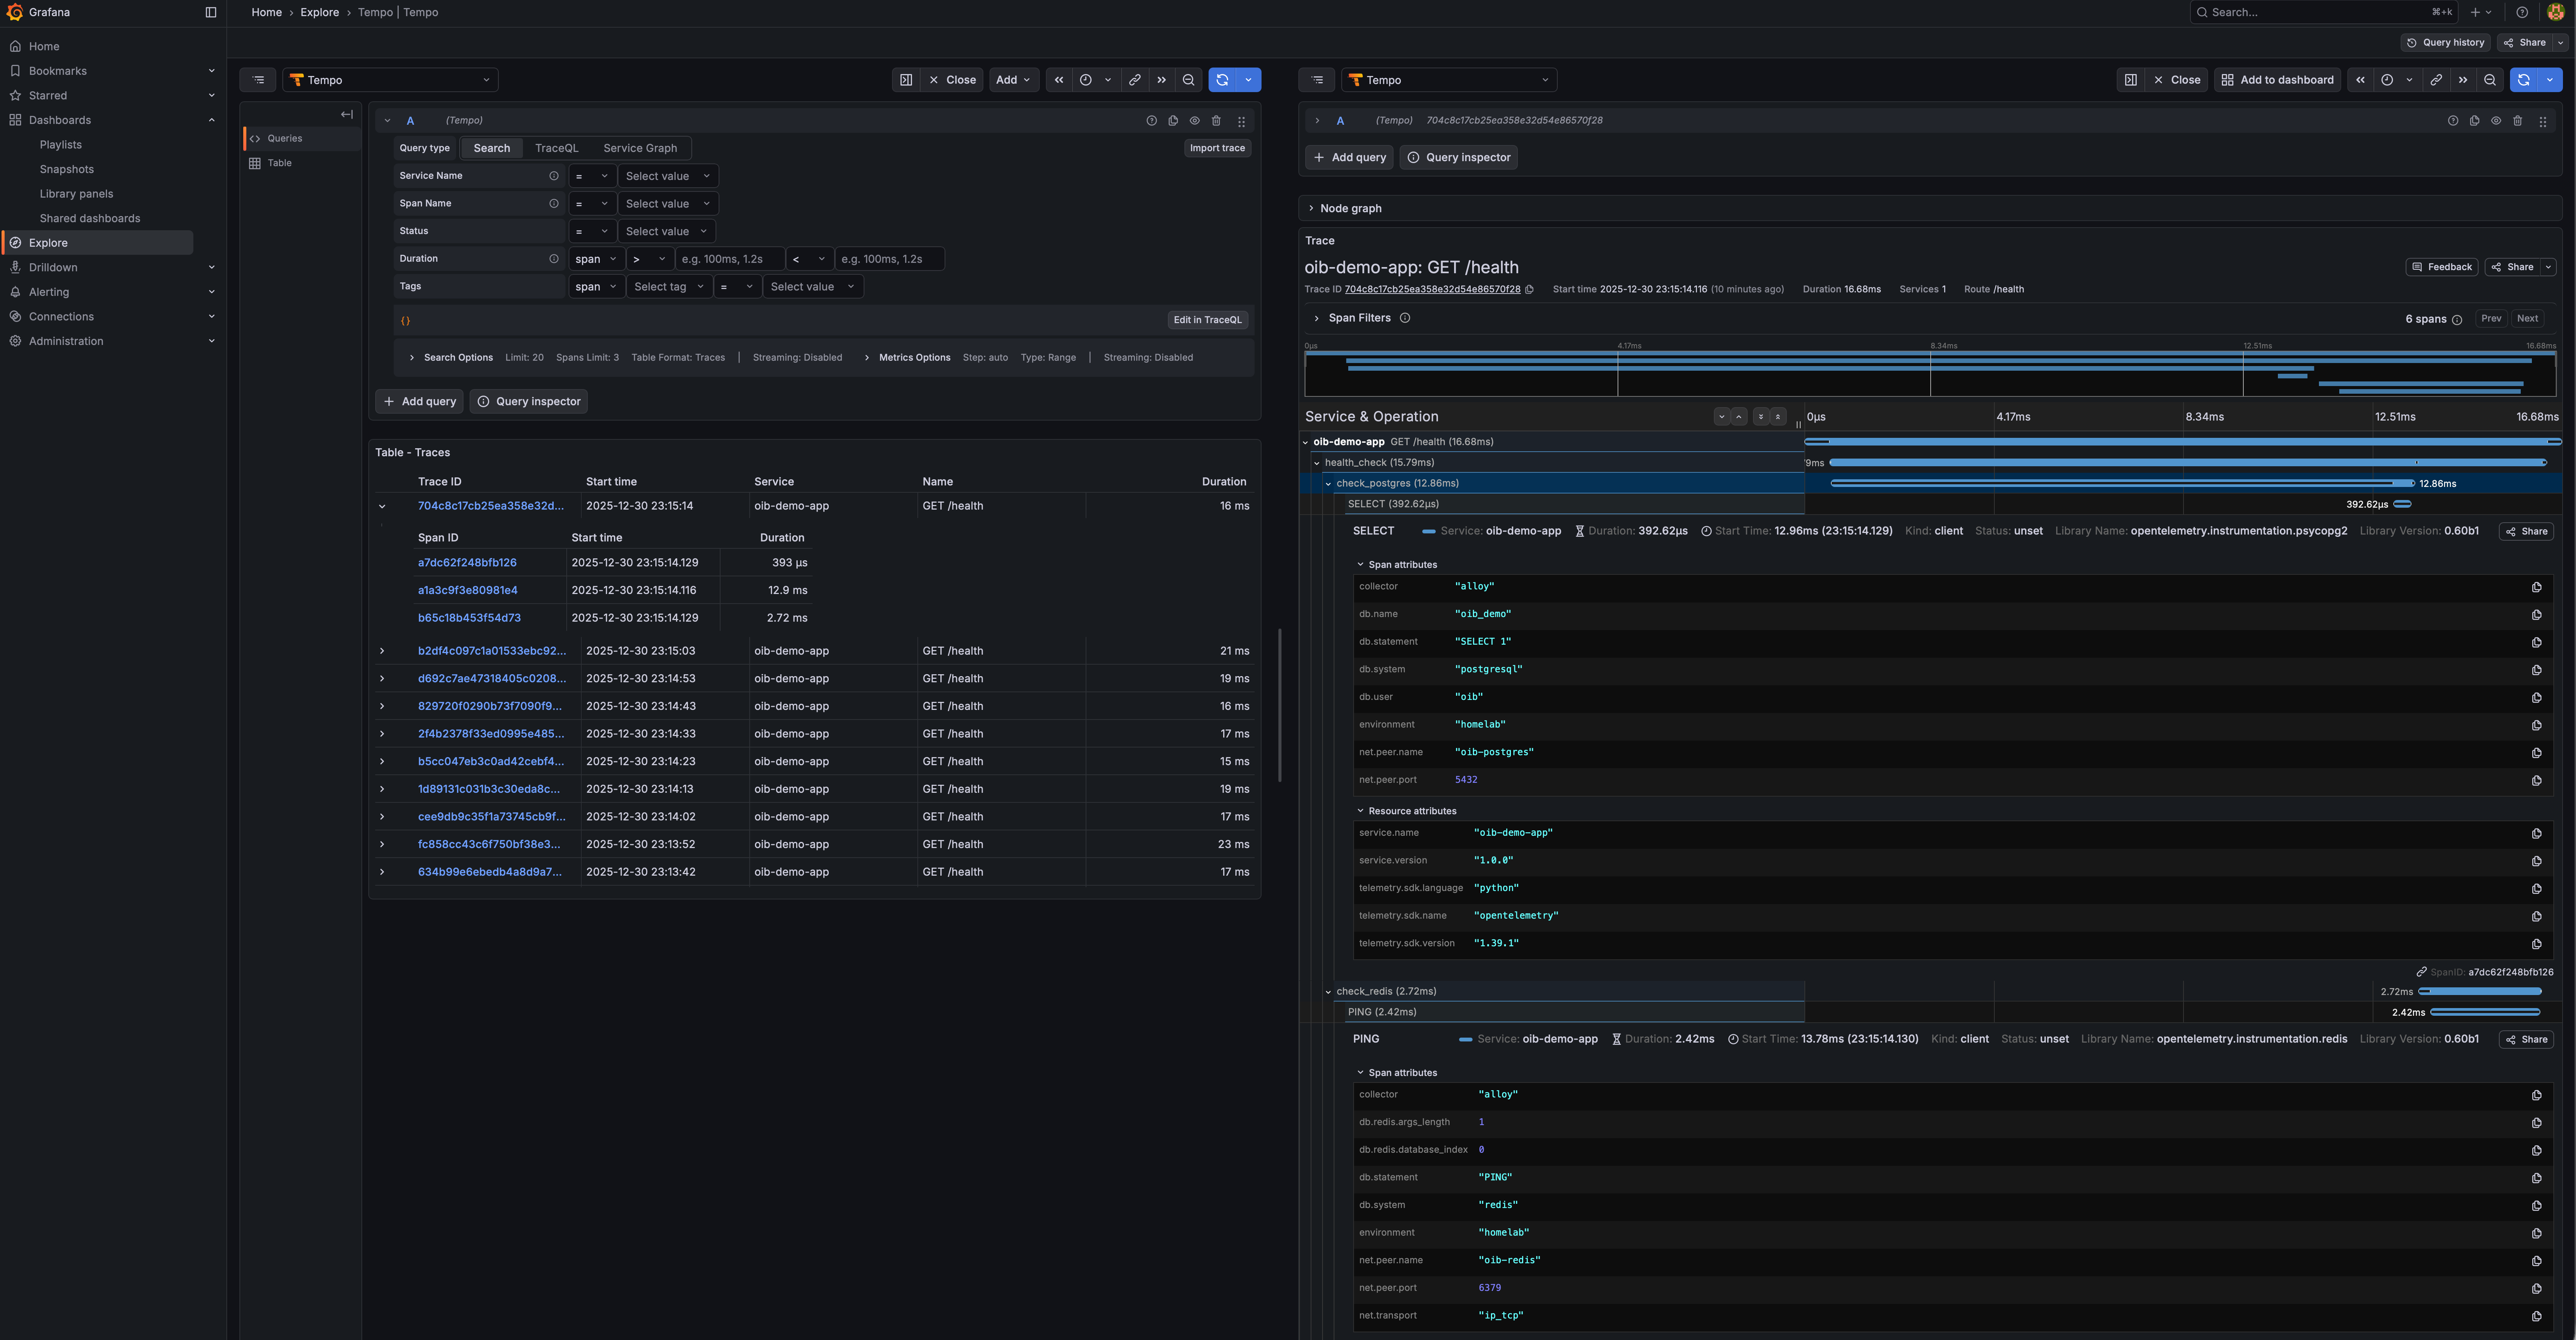
Traces Explorer
Full distributed tracing with PostgreSQL, Redis, and HTTP spans visible.
🛠️ Commands Reference
# Installation
make install              # Install all stacks
make install-logging      # Install logging stack only
make install-metrics      # Install metrics stack only
make install-telemetry    # Install telemetry stack only
make install-profiling    # Install profiling stack (optional)
make install-grafana      # Install unified Grafana

# Health & Diagnostics
make health               # Quick health check
make doctor               # Diagnose common issues (Docker, ports, config)
make status               # Show all services with health indicators
make check-ports          # Check if required ports are available
make ps                   # Show running OIB containers
make validate             # Validate configuration files

# Load Testing
make test-load            # Run k6 basic load test
make test-stress          # Run stress test (find breaking point)
make test-spike           # Run spike test (sudden traffic)
make test-api             # Run API endpoint load test

# Utilities
make open                 # Open Grafana in browser
make demo                 # Generate sample data (logs, metrics, traces)
make demo-examples        # Run example apps and generate traffic
make bootstrap            # Install + demo + open Grafana
make disk-usage           # Show disk space used by OIB
make version              # Show versions of running components

# Maintenance
make update               # Pull pinned version images and restart
make latest               # Pull and run :latest versions of all images
make logs                 # Tail logs from all stacks
make uninstall            # Remove all stacks and volumes (with confirmation)
⚙️ Configuration
All configuration is managed through a single .env file:
| Variable | Default | Description |
|---|---|---|
GRAFANA_ADMIN_PASSWORD |
(required) | Grafana admin password |
GRAFANA_PORT |
3000 |
Grafana web UI port |
LOKI_PORT |
3100 |
Loki API port (localhost only) |
PROMETHEUS_PORT |
9090 |
Prometheus API port (localhost only) |
OTEL_GRPC_PORT |
4317 |
OTLP gRPC receiver (public) |
OTEL_HTTP_PORT |
4318 |
OTLP HTTP receiver (public) |
PROMETHEUS_RETENTION_TIME |
15d |
Prometheus data retention time |
PROMETHEUS_RETENTION_SIZE |
5GB |
Prometheus data retention size |
📊 Data Retention
| Component | Retention | Config File |
|---|---|---|
| Loki (logs) | 7 days | logging/config/loki-config.yml |
| Tempo (traces) | 3 days | telemetry/config/tempo.yaml |
| Prometheus (metrics) | 15 days or 5GB | metrics/compose.yaml |
🔒 Security
OIB includes security hardening for local and self-hosted deployments:
- Localhost binding: Internal services (Prometheus, Loki, Tempo) only listen on
127.0.0.1 - Non-privileged containers: cAdvisor uses minimal capabilities instead of privileged mode
- Resource limits: All containers have CPU/memory limits
- No-new-privileges: Containers cannot gain additional privileges
- Non-root users: Example apps run as non-root users
- Docker HEALTHCHECK: All example Dockerfiles include health checks
Public ports (intentionally exposed for external access):
3000— Grafana UI4317/4318— OTLP endpoints for trace ingestion
💻 Example Integration
Python (Flask with OpenTelemetry)
from opentelemetry import trace
from opentelemetry.exporter.otlp.proto.grpc.trace_exporter import OTLPSpanExporter
from opentelemetry.sdk.trace import TracerProvider
from opentelemetry.sdk.trace.export import BatchSpanProcessor

provider = TracerProvider()
exporter = OTLPSpanExporter(endpoint="localhost:4317", insecure=True)
provider.add_span_processor(BatchSpanProcessor(exporter))
trace.set_tracer_provider(provider)

tracer = trace.get_tracer(__name__)

@app.route('/api/users')
def get_users():
    with tracer.start_as_current_span("get-users"):
        # Your code here
        return users
Node.js (Express)
const { NodeSDK } = require('@opentelemetry/sdk-node');
const { OTLPTraceExporter } = require('@opentelemetry/exporter-trace-otlp-grpc');

const sdk = new NodeSDK({
  traceExporter: new OTLPTraceExporter({
    url: 'http://localhost:4317',
  }),
  serviceName: 'my-node-app',
});
sdk.start();
Docker Compose Integration
services:
  my-app:
    environment:
      - OTEL_EXPORTER_OTLP_ENDPOINT=http://host.docker.internal:4318
      - OTEL_SERVICE_NAME=my-app
    networks:
      - oib-network

networks:
  oib-network:
    external: true
💡 OIB also includes complete working examples for Ruby on Rails and PHP Laravel in the
examples/directory.
👥 Who This Is For
- Developers who want to understand how their app behaves without becoming observability experts
- Self-hosters who want proper monitoring without enterprise complexity
- Small teams who need observability but don’t have dedicated SRE staff
- Anyone learning about metrics, logs, and traces in a hands-on way
📄 License
MIT License — use it however you want.
Ready to get started?
View on GitHub🚀 Need Help Getting Started?
Self-hosting is free and always will be. But if you'd rather have it deployed, configured, and maintained for you — I can help.