SIEM in a Box
(SIB)
One-command security monitoring with Falco and VictoriaLogs. Runtime detection, optional AI analysis, and Grafana dashboards.
Security monitoring shouldn't require a six-figure budget and a dedicated team. SIB provides enterprise-grade security visibility using open source tools, with a fast VictoriaMetrics stack by default and optional AI-powered alert analysis.
⚡ Quick Start
# Clone and configure
git clone https://github.com/matijazezelj/sib.git && cd sib
cp .env.example .env

# Install everything (auto-configures based on STACK)
make install

# Verify the pipeline
./scripts/test-pipeline.sh

# Generate demo security events
make demo
Open Grafana at http://localhost:3000 and watch security events flow in.
🗄️ Storage Backend
SIB supports two storage stacks. Choose one via STACK in .env:
| Stack | Components | Best For |
|---|---|---|
vm (default) |
VictoriaLogs + VictoriaMetrics + node_exporter | Low RAM usage, faster queries, recommended |
grafana |
Loki + Prometheus + Alloy | Grafana ecosystem, native integrations |
# In .env
STACK=vm        # Default - VictoriaMetrics ecosystem
# STACK=grafana # Alternative - Grafana ecosystem
🧠 How It Works
Not a network sniffer! SIB uses Falco’s eBPF-based syscall monitoring — it watches what programs do at the kernel level, not network packets. No mirror ports, TAPs, or bridge interfaces needed. Just install on any Linux host with kernel 5.8+ and it sees everything that host does.
Prerequisites
- Docker CE 20.10+ from docker.com with Docker Compose v2+, or Podman 4.0+ in rootful mode
- Linux kernel 5.8+ (for modern_ebpf driver)
- 4GB+ RAM recommended
⚠️ Note: Docker Desktop is not supported. Install Docker CE (Community Edition) directly from docker.com or use Podman.
Hardware Requirements
| Setup | CPU | RAM | Disk | Notes |
|---|---|---|---|---|
| SIB Server (single host) | 2 cores | 4GB | 20GB | Runs Falco + full stack |
| SIB Server (with fleet) | 4 cores | 8GB | 50GB+ | More storage for logs from multiple hosts |
| Fleet Agent | 1 core | 512MB | 1GB | Falco + collectors (vmagent or Alloy) |
🛡️ What You Get
| Component | Technology | Purpose |
|---|---|---|
| Detection | Falco | Runtime security using eBPF syscall monitoring |
| Routing | Falcosidekick | Alert routing to 50+ destinations |
| Storage | VictoriaLogs (default) or Loki | Log aggregation optimized for security events |
| Metrics | VictoriaMetrics (default) or Prometheus | Metrics collection and alerting |
| Host Metrics | node_exporter | Host metrics for fleet views (VM stack) |
| Visualization | Grafana | Pre-built security dashboards |
| Threat Intel | Multiple feeds | Automatic IOC updates |
🎯 What Gets Detected
Out of the box, SIB catches:
| Category | Examples |
|---|---|
| Credential Access | Reading /etc/shadow, SSH key access |
| Container Security | Shells in containers, privileged operations |
| File Integrity | Writes to /etc, sensitive config changes |
| Process Anomalies | Unexpected binaries, shell spawning |
| Persistence | Cron modifications, systemd changes |
| Cryptomining | Mining processes, pool connections |
All detection rules are mapped to MITRE ATT&CK techniques.
📊 Security Dashboards
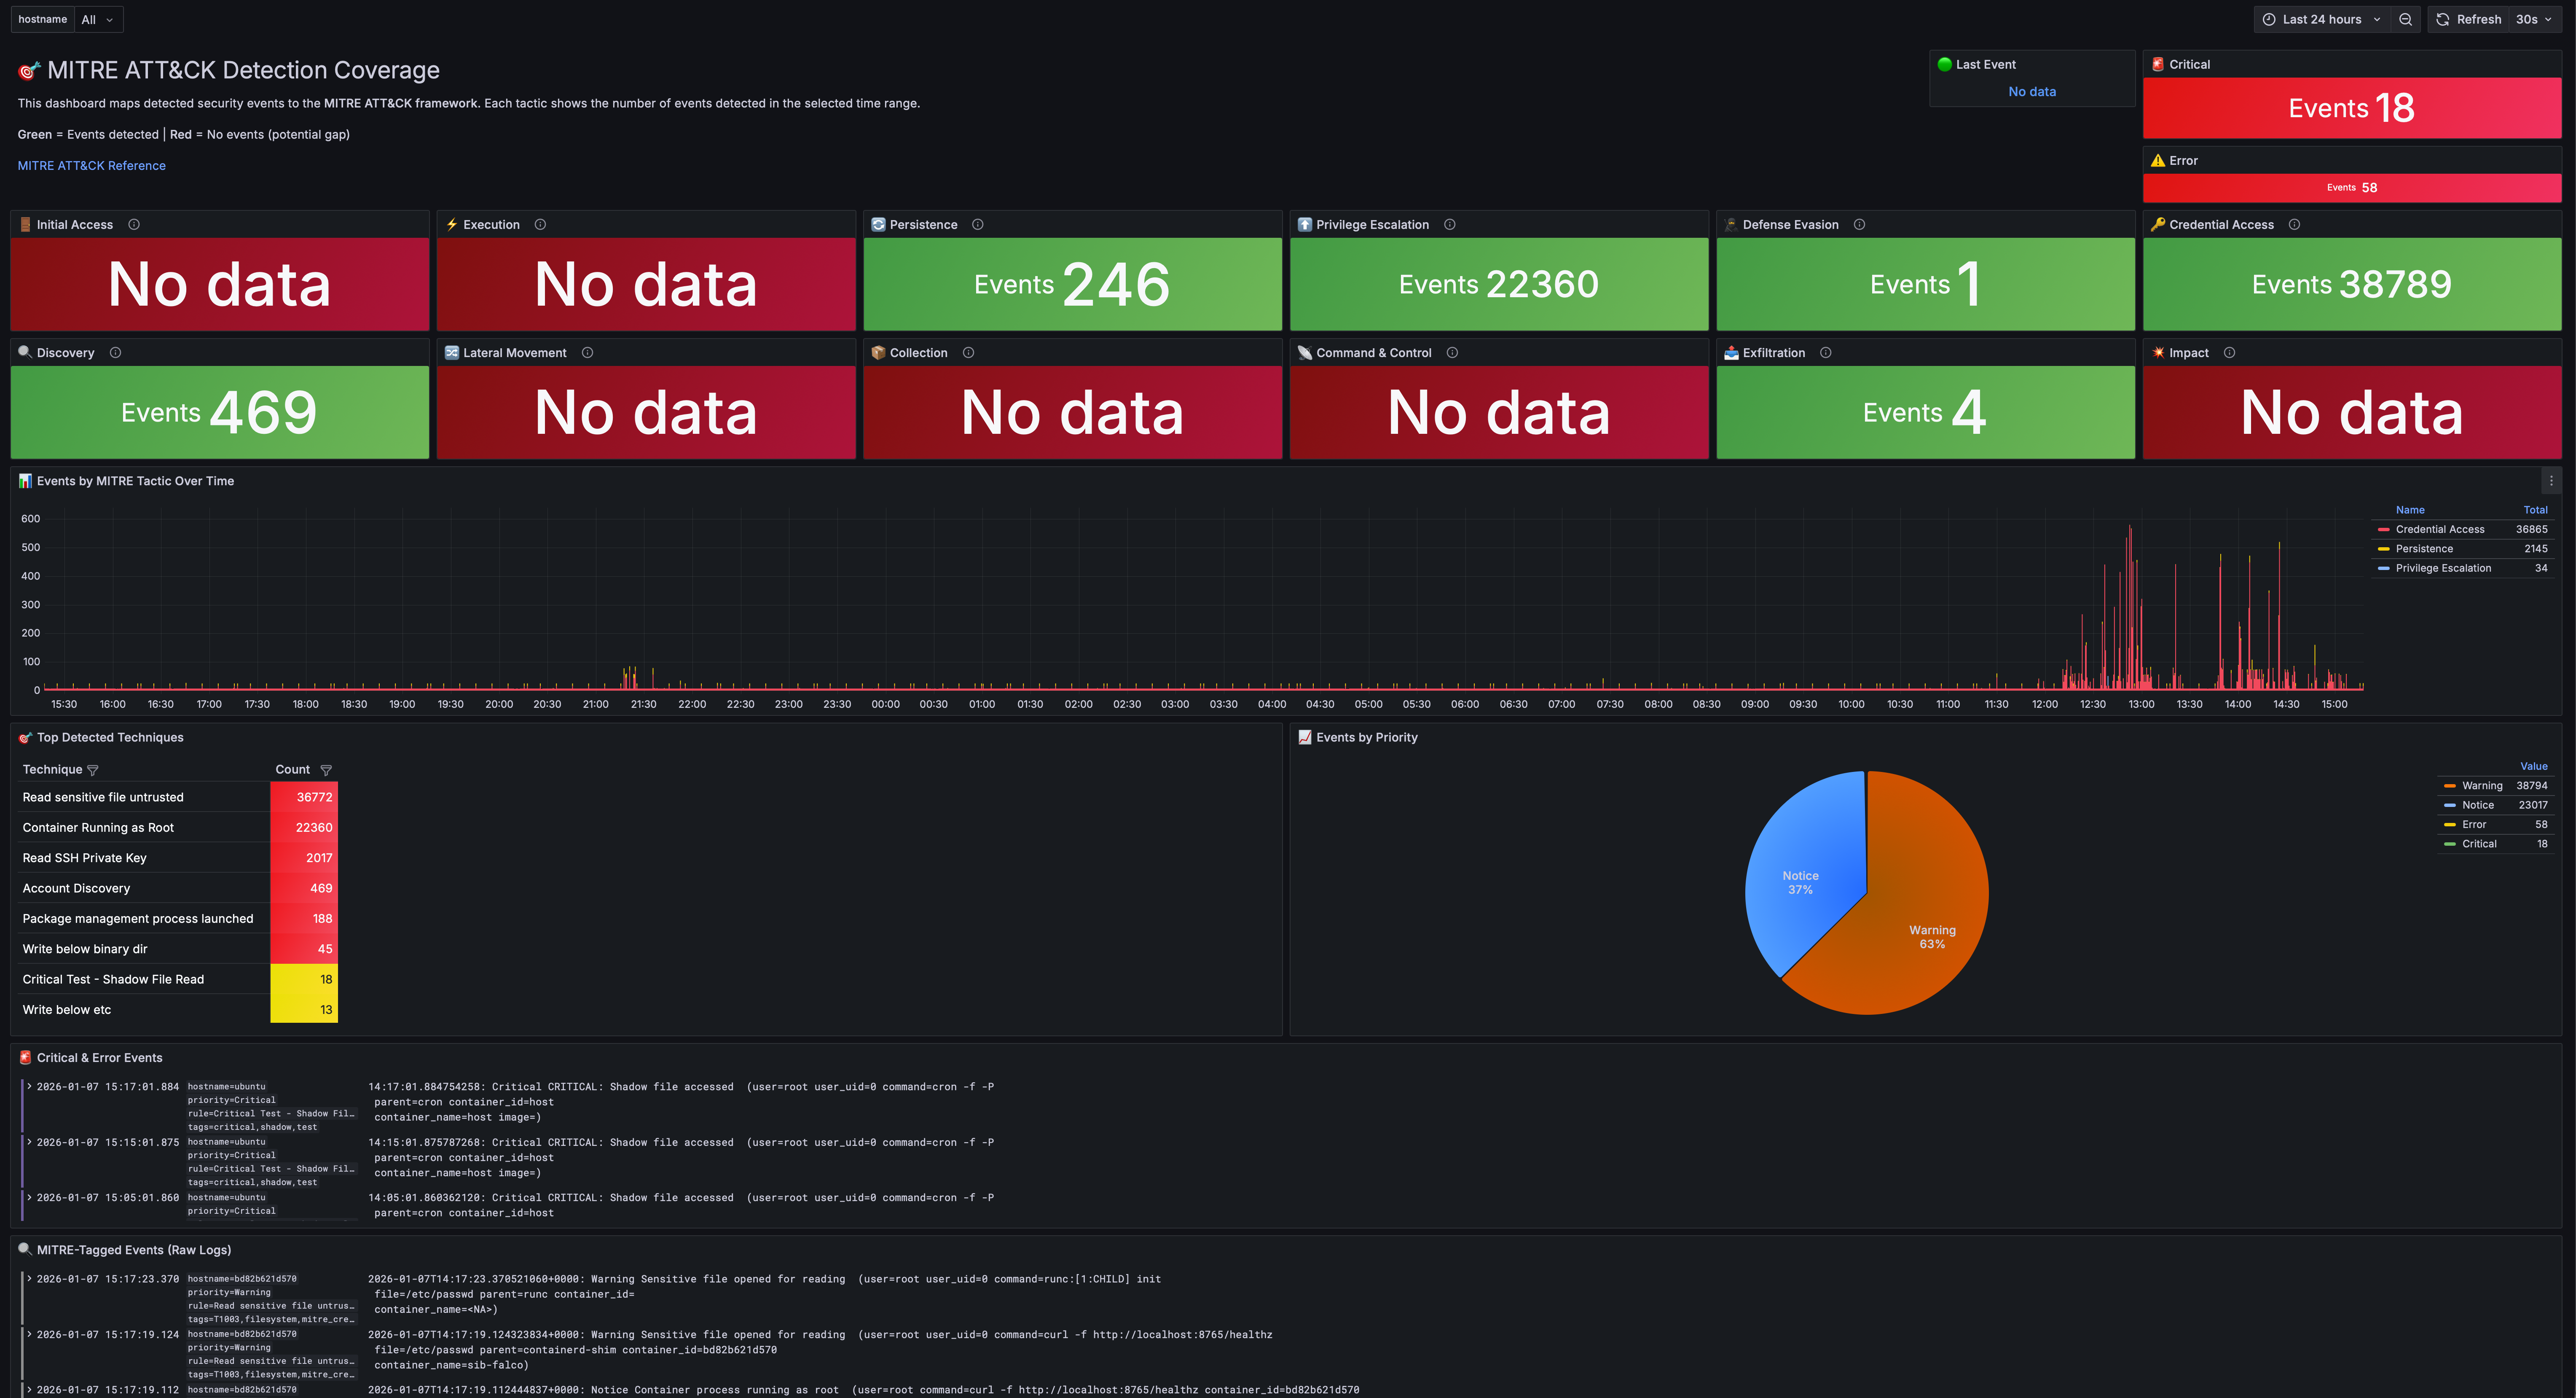
MITRE ATT&CK Coverage
Every MITRE ATT&CK tactic gets a panel. See at a glance what you’re detecting — and what you’re not. Includes hostname filter to focus on specific hosts.
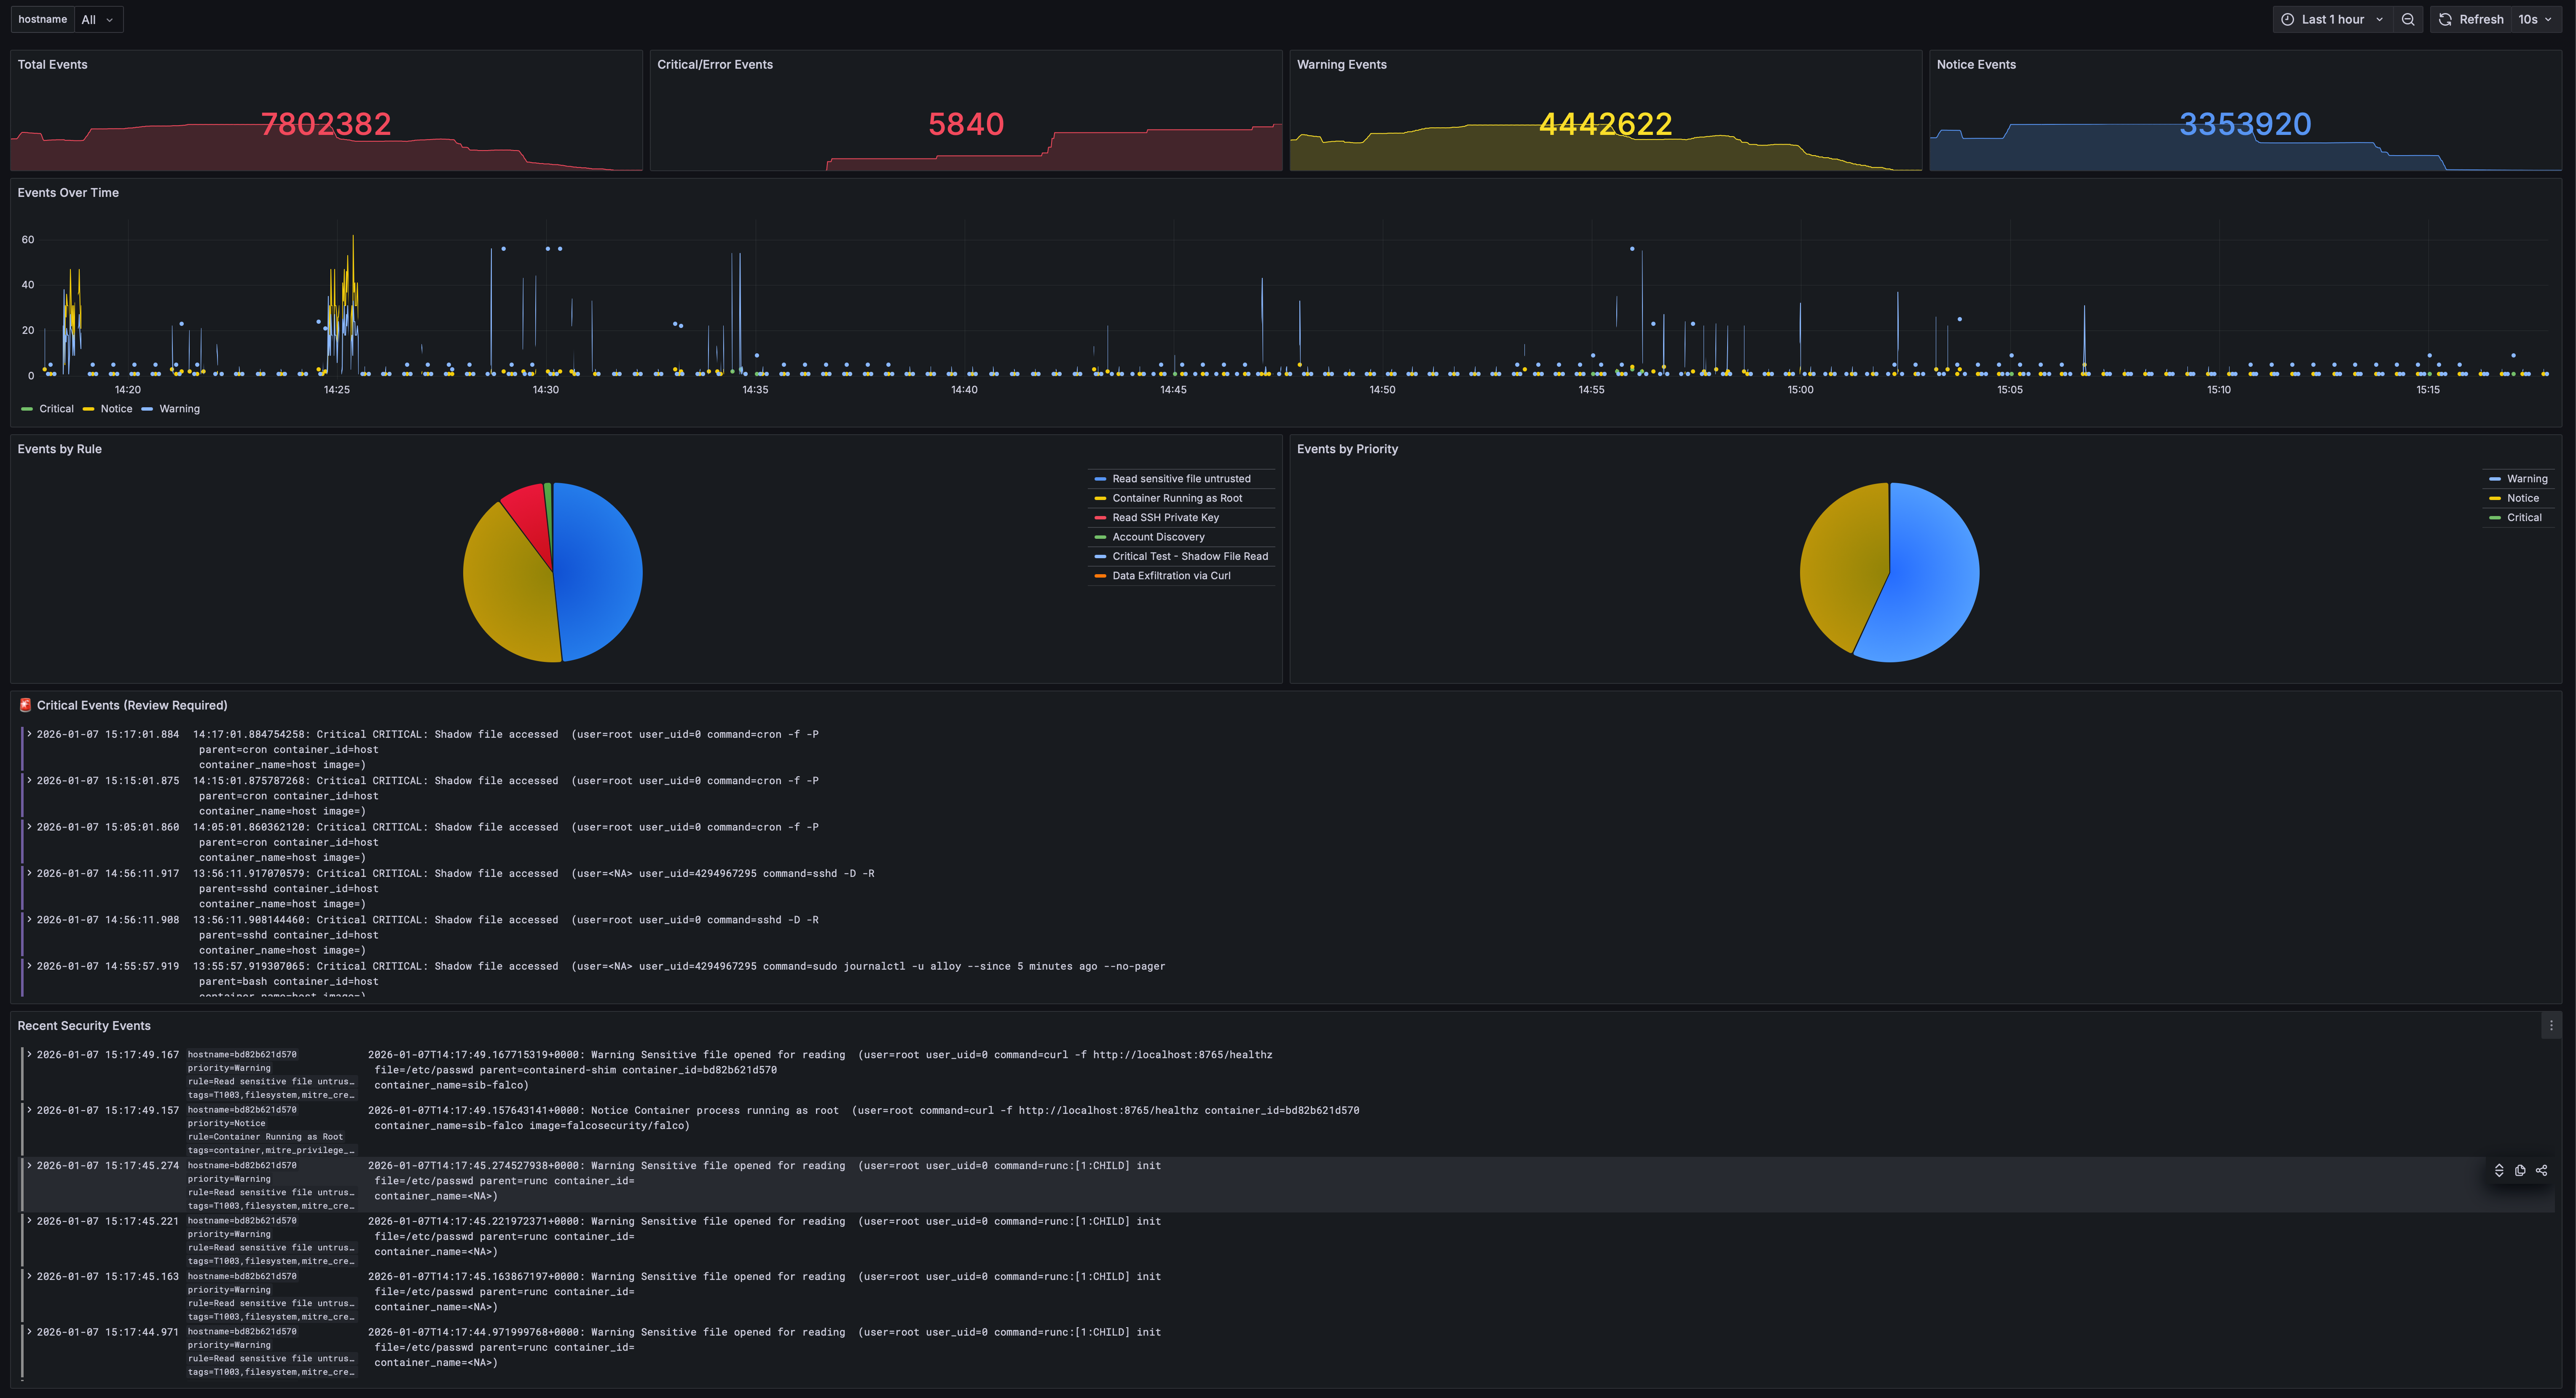
Security Overview
Total events, critical alerts, and real-time event streams organized by priority. Filter by hostname to focus on specific hosts.
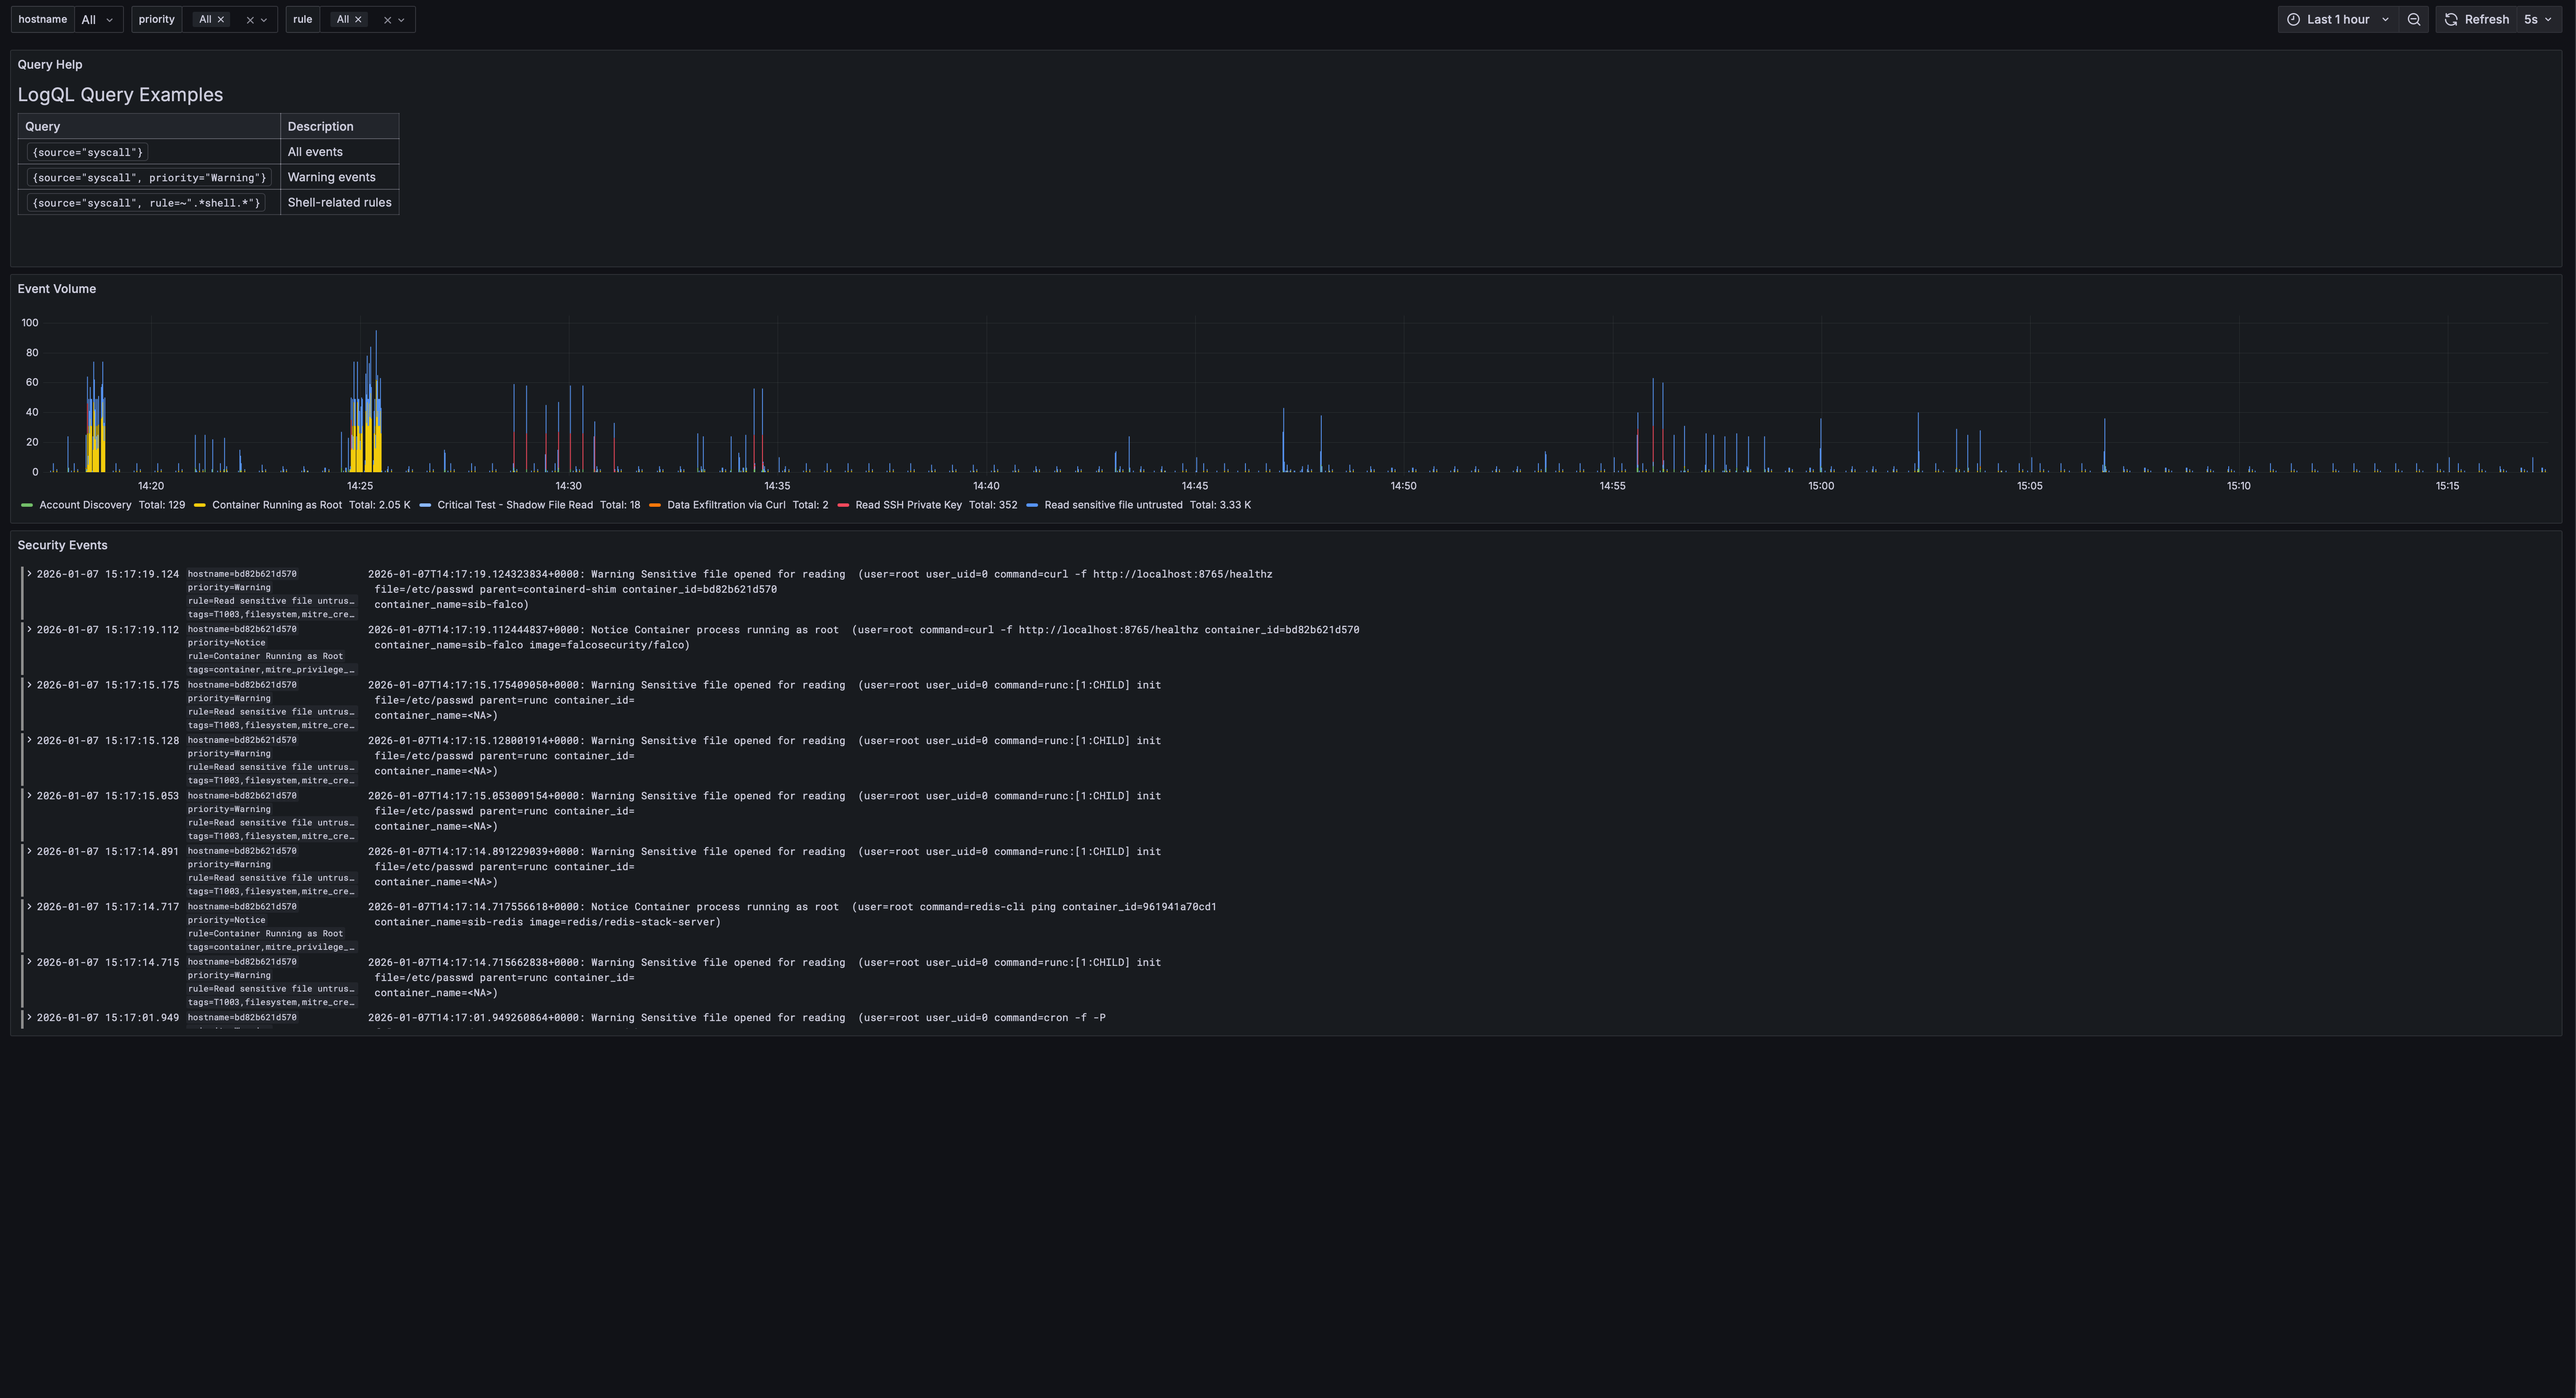
Events Explorer
Filter by priority, rule name, hostname, and drill down into specific events with full LogQL support.
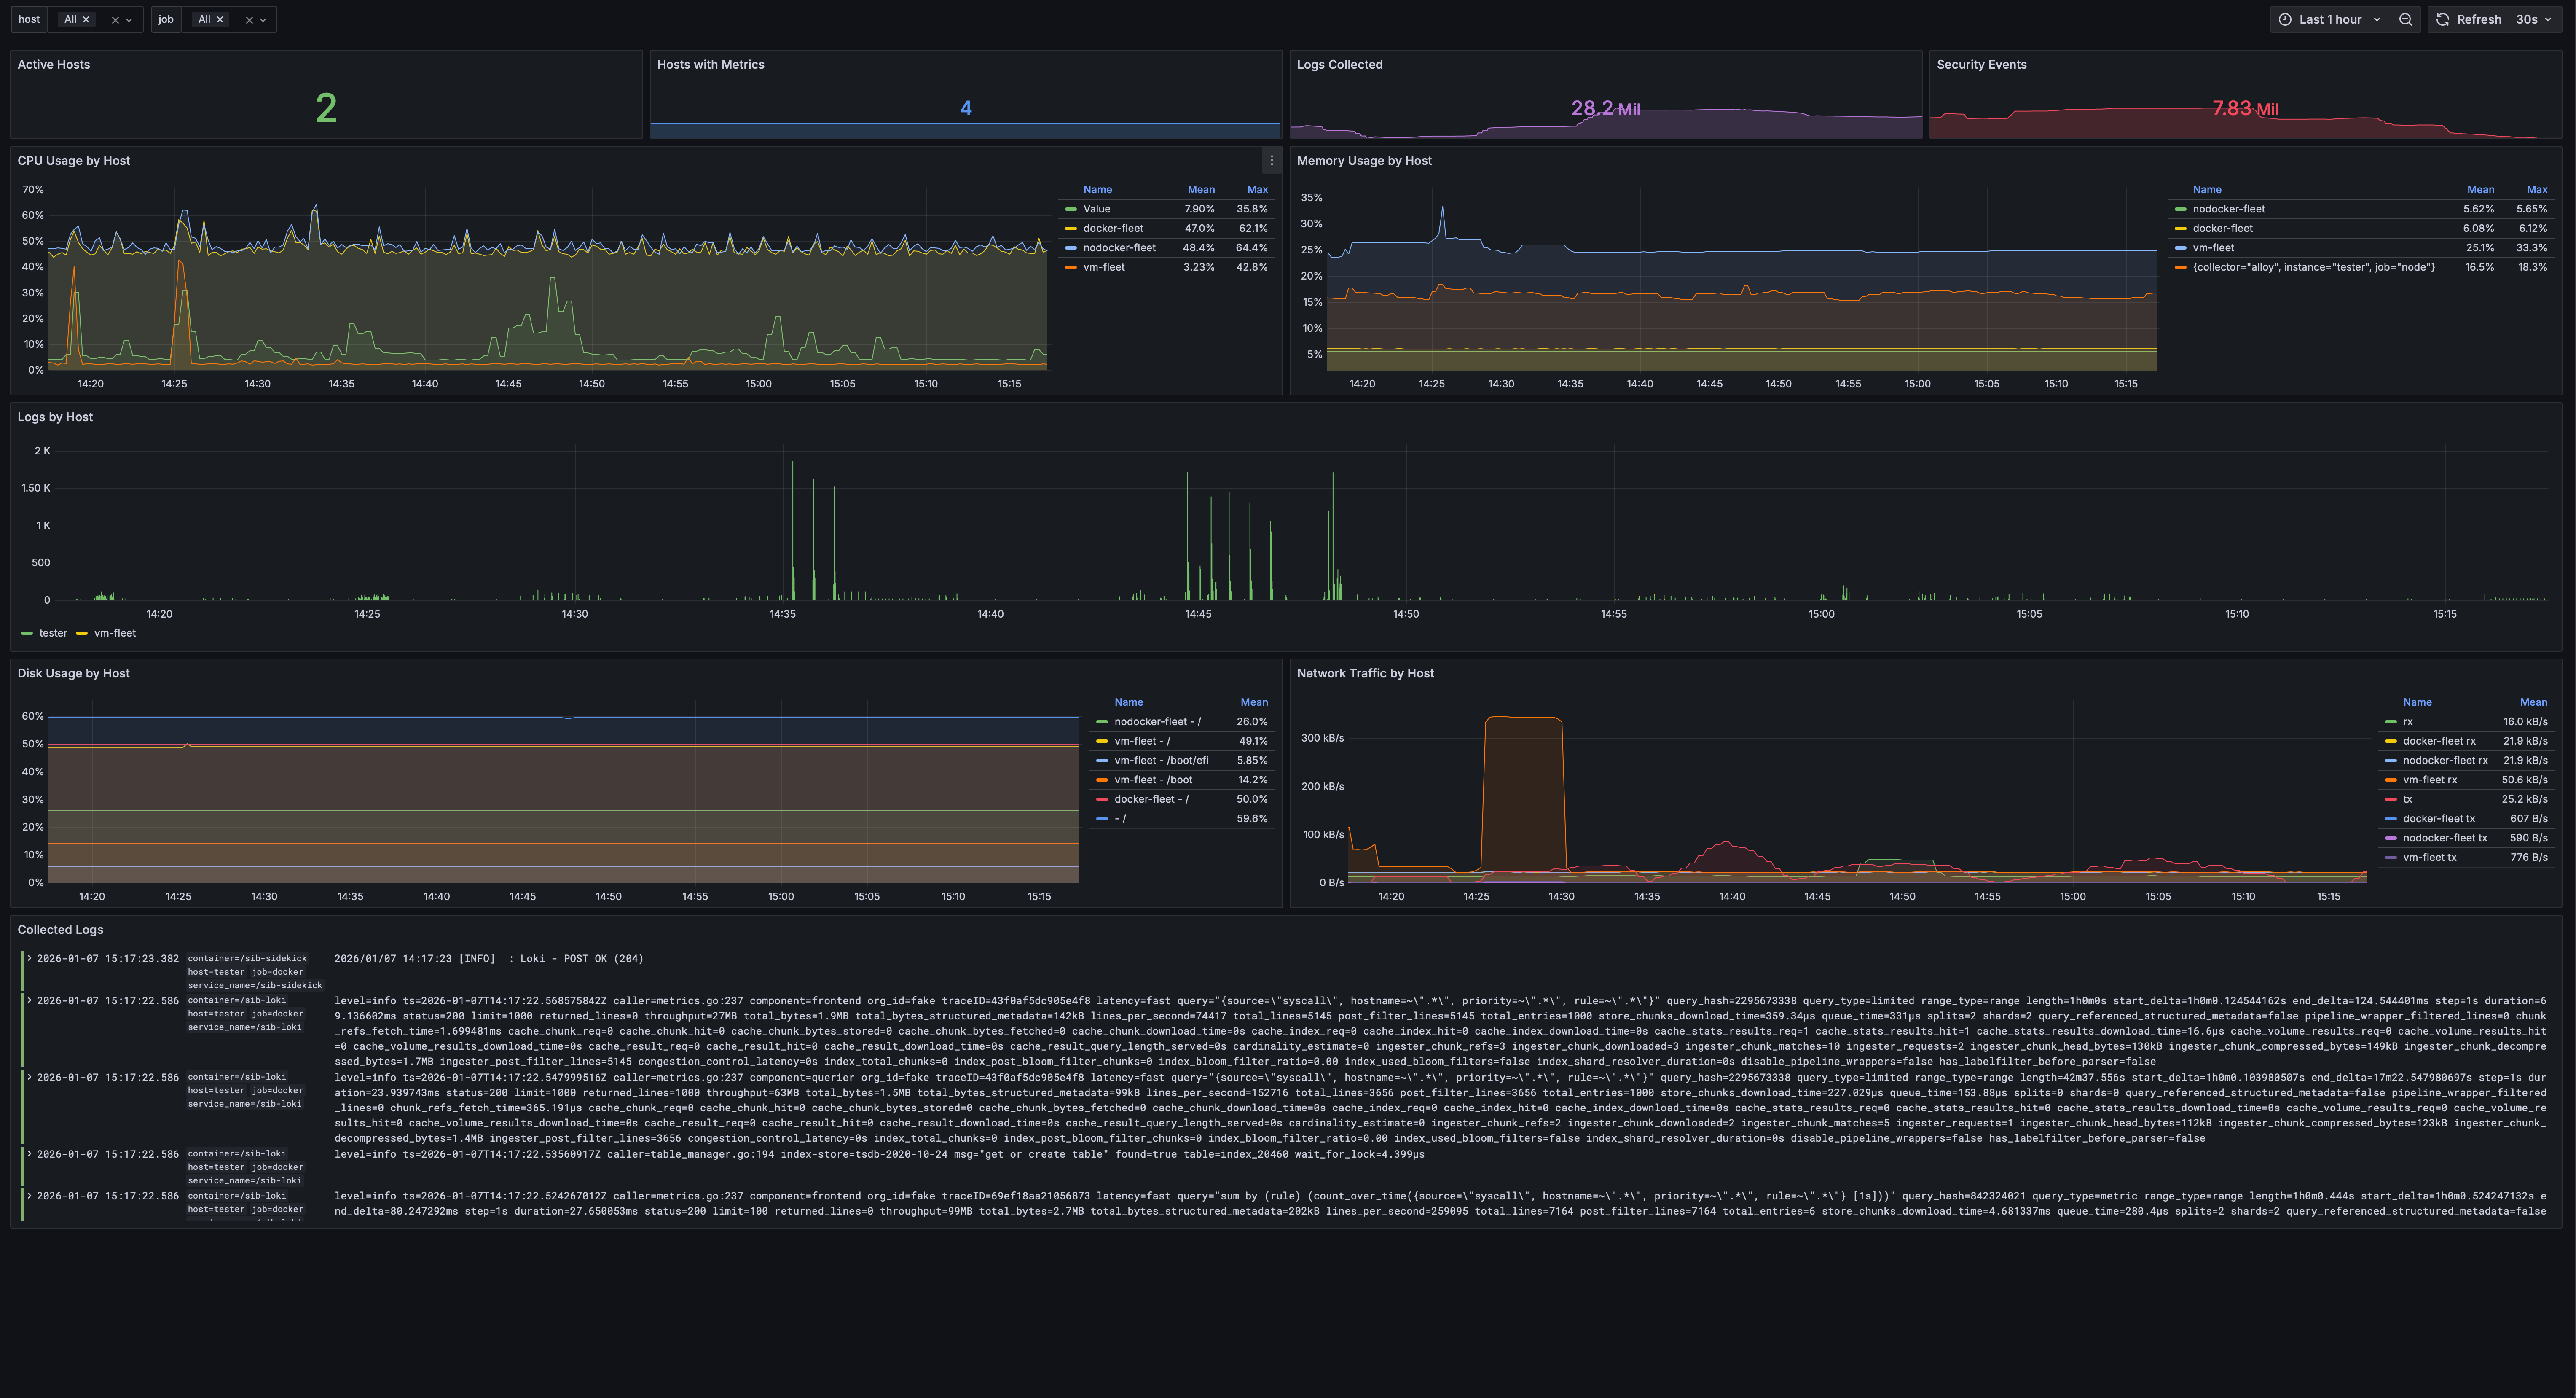
Fleet Overview
Monitor multiple hosts with CPU, memory, disk, and network metrics. Hostname selector filters all panels to focus on individual hosts.
🤖 AI-Powered Alert Analysis (Beta)
Got an alert but not sure what it means? SIB can analyze your security events using LLMs.
make install-analysis
You get:
- Attack vector explanation — What the attacker is trying to do
- MITRE ATT&CK mapping — Tactic and technique IDs
- Risk assessment — Severity, confidence, impact
- Mitigation steps — Immediate, short-term, long-term actions
- False positive assessment — Is this real or noise?
Privacy First
Your sensitive data never leaves your network (unless you want it to). Before sending anything to the LLM, all PII is obfuscated:
| Data Type | What Happens |
|---|---|
| IP addresses | → [INTERNAL-IP-1], [EXTERNAL-IP-1] |
| Usernames | → [USER-1] |
| Hostnames | → [HOST-1] |
| Container IDs | → [CONTAINER-1] |
| Secrets | → [REDACTED] |
LLM Options
| Provider | Where data goes | Best for |
|---|---|---|
| Ollama (default) | Your machine | Privacy-conscious users |
| OpenAI | OpenAI API (obfuscated) | Better quality |
| Anthropic | Anthropic API (obfuscated) | Claude fans |
Preview what gets sent before any LLM call:
make analyze-dry-run
📡 Sigma Rules Support
Bring your existing detection rules. SIB includes a converter that transforms Sigma rules into:
- Falco rules — For runtime detection
- LogsQL alerts — For log-based detection in VictoriaLogs (or LogQL for Loki when using the Grafana stack)
make convert-sigma
The entire Sigma community rules ecosystem is available to you.
🌐 Threat Intelligence
SIB automatically pulls IOC feeds from:
| Feed | Data | Source |
|---|---|---|
| Feodo Tracker | Banking trojan C2 servers | abuse.ch |
| SSL Blacklist | Malicious SSL certificates | abuse.ch |
| Emerging Threats | Compromised IPs | emergingthreats.net |
| Spamhaus DROP | Hijacked IP ranges | spamhaus.org |
| Blocklist.de | Brute force attackers | blocklist.de |
| CINSscore | Threat intelligence scoring | cinsscore.com |
make update-threatintel
🚀 Fleet Management
Got more than one server? SIB includes Ansible-based fleet management — no local Ansible needed, it runs in Docker.
┌─────────────────────────────────────────────────────────┐
│                    SIB Central Server                    │
│  ┌─────────┐ ┌──────────────┐ ┌──────────────┐ ┌─────────┐       │
│  │ Grafana │ │ Log Storage  │ │ Metrics DB   │ │Sidekick │       │
│  └─────────┘ └──────────────┘ └──────────────┘ └─────────┘       │
└─────────────────────────▲──────────────▲────────────────┘
                          │              │
     ┌────────────────────┼──────────────┼────────────────┐
     │   Host A           │   Host B     │   Host C       │
     │ Falco + Alloy ─────┴──────────────┴─── ...         │
     └────────────────────────────────────────────────────┘
Deployment Strategy
SIB supports both native packages and Docker containers:
| Strategy | Description |
|---|---|
| auto (default) | Use Docker if available, otherwise native |
| docker | Run agents as containers. Recommended for simplicity. |
| native | Falco from repo as systemd service |
Note: VM stack collectors (Vector, vmagent, node_exporter) always run as Docker containers. The strategy setting primarily affects Falco deployment.
⚠️ LXC Limitation: Falco cannot run in LXC containers due to kernel access restrictions. Use VMs or run Falco on the LXC host itself.
# Configure your hosts
cp ansible/inventory/hosts.yml.example ansible/inventory/hosts.yml

# Test connectivity
make fleet-ping

# Deploy agents to all hosts
make deploy-fleet

# Or target specific hosts
make deploy-fleet LIMIT=webserver
📡 Remote Collectors
Deploy lightweight collectors to ship logs and metrics from remote hosts to your central SIB server.
| SIB Stack | Collectors | Components |
|---|---|---|
vm (default) |
VM Collectors | Vector (logs) + vmagent + node_exporter (metrics) |
grafana |
Alloy | Grafana Alloy (logs + metrics) |
┌─────────────────────────────────────────────────────────┐
│                   Hub and Spoke Model                    │
├─────────────────────────────────────────────────────────┤
│  ┌────────────┐  ┌────────────┐  ┌────────────┐          │
│  │   Host A   │  │   Host B   │  │   Host C   │          │
│  │(Collectors)│  │(Collectors)│  │(Collectors)│          │
│  └──────┬─────┘  └──────┬─────┘  └──────┬─────┘          │
│        │            │            │                   │
│        └────────────┼────────────┘                   │
│                     │                                    │
│           ┌──────────────────┐                          │
│           │    SIB Server    │                          │
│           │  VictoriaLogs    │  ◀ Logs                   │
│           │  VictoriaMetrics │  ◀ Metrics                │
│           │  Grafana         │  ◀ Fleet Overview         │
│           └──────────────────┘                          │
└─────────────────────────────────────────────────────────┘
# Enable external access for collectors
make enable-remote

# Deploy collector to remote host
make deploy-collector HOST=user@remote-host
What Gets Collected
| Type | Sources | Labels |
|---|---|---|
| System Logs | /var/log/syslog, /var/log/messages |
job="syslog" |
| Auth Logs | /var/log/auth.log, /var/log/secure |
job="auth" |
| Kernel Logs | /var/log/kern.log |
job="kernel" |
| Journal | systemd journal | job="journal" |
| Docker Logs | All containers | job="docker" |
| Node Metrics | CPU, memory, disk, network | job="node" |
🎭 Demo Mode
Generate realistic security events locally on your SIB server — no fleet setup required. Perfect for first-time users, demonstrations, or testing detection capabilities.
# Run comprehensive demo (~30 events across 9 MITRE ATT&CK categories)
make demo

# Quick demo with 1-second delays
make demo-quick
Demo Coverage
| Tactic | Events Generated |
|---|---|
| Credential Access | Shadow file access, /etc/passwd reads |
| Execution | Shell spawning, script execution |
| Persistence | Cron job creation, systemd manipulation |
| Defense Evasion | Log clearing, history deletion |
| Discovery | System enumeration, network scanning |
| Impact | Crypto miner detection |
| Container Escape | Docker socket access, namespace breakout |
| Lateral Movement | SSH key access, authorized_keys reads |
| File Integrity | /etc/ file modifications |
🔍 Comparison
| Tool | Pros | Cons | Best for |
|---|---|---|---|
| SIB | One-command setup, Falco runtime detection, curated dashboards, self-hosted | Not a full log SIEM platform, Linux-only detection | Homelabs, startups, lean SecOps teams |
| Wazuh | Strong host-based SIEM, broad OS support, built-in agents | Heavier setup, more tuning required | Organizations needing HIDS + log SIEM |
| Splunk | Powerful search/analytics, enterprise-grade scale | Expensive at scale, complex operations | Large enterprises with budget and dedicated SIEM team |
| Elastic SIEM | Flexible, open-source core, great search | Requires careful sizing/tuning, operational overhead | Teams already using Elastic Stack |
🛠️ Commands Reference
# Installation
make install              # Install all stacks
make uninstall            # Remove everything

# Management
make start                # Start all services
make stop                 # Stop all services
make restart              # Restart all services
make status               # Show service status
make health               # Quick health check
make doctor               # Diagnose common issues

# Logs
make logs                 # Tail all logs
make logs-falco           # Tail Falco logs
make logs-sidekick        # Tail Falcosidekick logs

# Demo & Testing
make demo                 # Run comprehensive security demo (~30 events)
make demo-quick           # Run quick demo (1s delay)
make test-alert           # Generate a test security alert

# Threat Intel & Sigma
make update-threatintel   # Download threat intel feeds
make convert-sigma        # Convert Sigma rules to Falco

# AI Analysis (Optional)
make install-analysis     # Install AI analysis API
make logs-analysis        # View analysis API logs

# Fleet Management
make deploy-fleet         # Deploy Falco + Alloy to all fleet hosts
make update-rules         # Push detection rules to fleet
make fleet-health         # Check health of all agents
make fleet-docker-check   # Check/install Docker on fleet hosts
make fleet-ping           # Test SSH connectivity
make fleet-shell          # Open shell in Ansible container
make remove-fleet         # Remove agents from fleet

# Remote Collectors
make enable-remote        # Enable external access for collectors
make deploy-collector     # Deploy collector to remote host

# Remote Collectors
make enable-remote        # Enable external access for collectors
make deploy-collector     # Deploy collector to remote host

# Backup & Restore
make backup               # Create timestamped backup
make restore              # Restore from a backup file

# Utilities
make open                 # Open Grafana in browser
make info                 # Show all endpoints
� Security & Hardening
- Internal services (Loki, Prometheus) bind to localhost only
- Grafana and Sidekick API are externally accessible (for fleet support)
- Falco requires privileged access for syscall monitoring
- mTLS available for encrypted fleet communication (
make generate-certs) - Change default Grafana password in production
�👥 Who This Is For
- Small security teams who need visibility but don’t have SIEM budget
- Homelab enthusiasts who want to monitor their infrastructure properly
- DevSecOps engineers who want security visibility in their pipeline
- Anyone learning security monitoring hands-on
- Red teamers who want to test if their activity gets caught
Who This Is NOT For
- Large enterprises with dedicated SOC teams — you probably need the scale of commercial tools
- People who want a managed service — this is self-hosted
- Compliance checkbox hunters — this gives you real security, not audit theater
📄 License
Apache 2.0 License — use it, modify it, build on it.
Ready to secure your infrastructure?
View on GitHub🚀 Need Help Getting Started?
Self-hosting is free and always will be. But if you'd rather have it deployed, configured, and maintained for you — I can help.